
entries ÷ people passing by
15.0%
of people passing by decided to enter
The conversion funnel that was invisible is now measurable
Sentinela connects traffic outside your store to the journey inside, showing where opportunities are captured, advanced, or lost.
Estimated purchase is an experimental journey inference and does not confirm a sale, revenue, or financial transaction.
Sentinela
Conversion funnel
Physical retail's blind spot
Without separating external traffic from internal performance, a decline can look like weak demand when the storefront is the issue—or look operational when the corridor simply got quieter.
How many people passed in front of the store?
What share of that traffic decided to enter?
What share of entries progressed to an estimated purchase?
Sentinela separates traffic effects from operational effects.
The metric that changes the reading
Volume shows the size of the traffic. The rate shows the effectiveness of the storefront, campaign, and proposition in that context.
entries ÷ people passing by
15.0%
of people passing by decided to enter
The same number of entries can represent very different performance when corridor traffic changes.
First identify which transition lost efficiency. Then investigate the operational causes that are compatible with it.
Passers → Entry
15.0% attraction rate
Is the store turning available corridor traffic into entries?
Hypotheses to compare for attraction
Entry → Estimated purchase
18.9% estimated internal conversion
Are visits progressing through the store toward an estimated purchase?
Hypotheses to compare inside the store
Estimated purchase is an experimental journey inference and does not confirm a sale, revenue, or financial transaction.
Compare what actually changed
Normalizing by available traffic reveals the response to the storefront and collection without confusing efficiency with volume.
Before the new collection
After the new collection
+50%
Attraction-rate lift
-18% corridor traffic
Even with about 18% fewer people passing by, the storefront converted a 50% larger share of traffic into entries.
The change appears in the attraction rate. That directs the first analysis toward the store's external elements, without concluding that any one of them caused the result.
What happens after entry
Attraction shows who entered. Trends, zones, and duration reveal how those visits behaved inside the store and help direct the next investigation.
Daily entries across equivalent periods.
Average time in store
24 min
+33% vs 18 min
Visits without engagement
18.0%
-9.0 pp vs 27.0%
Bounce rate: completed visits that did not qualify dwell in an engagement zone or at checkout.
Locate where circulation and dwell concentrate across the store floor plan.
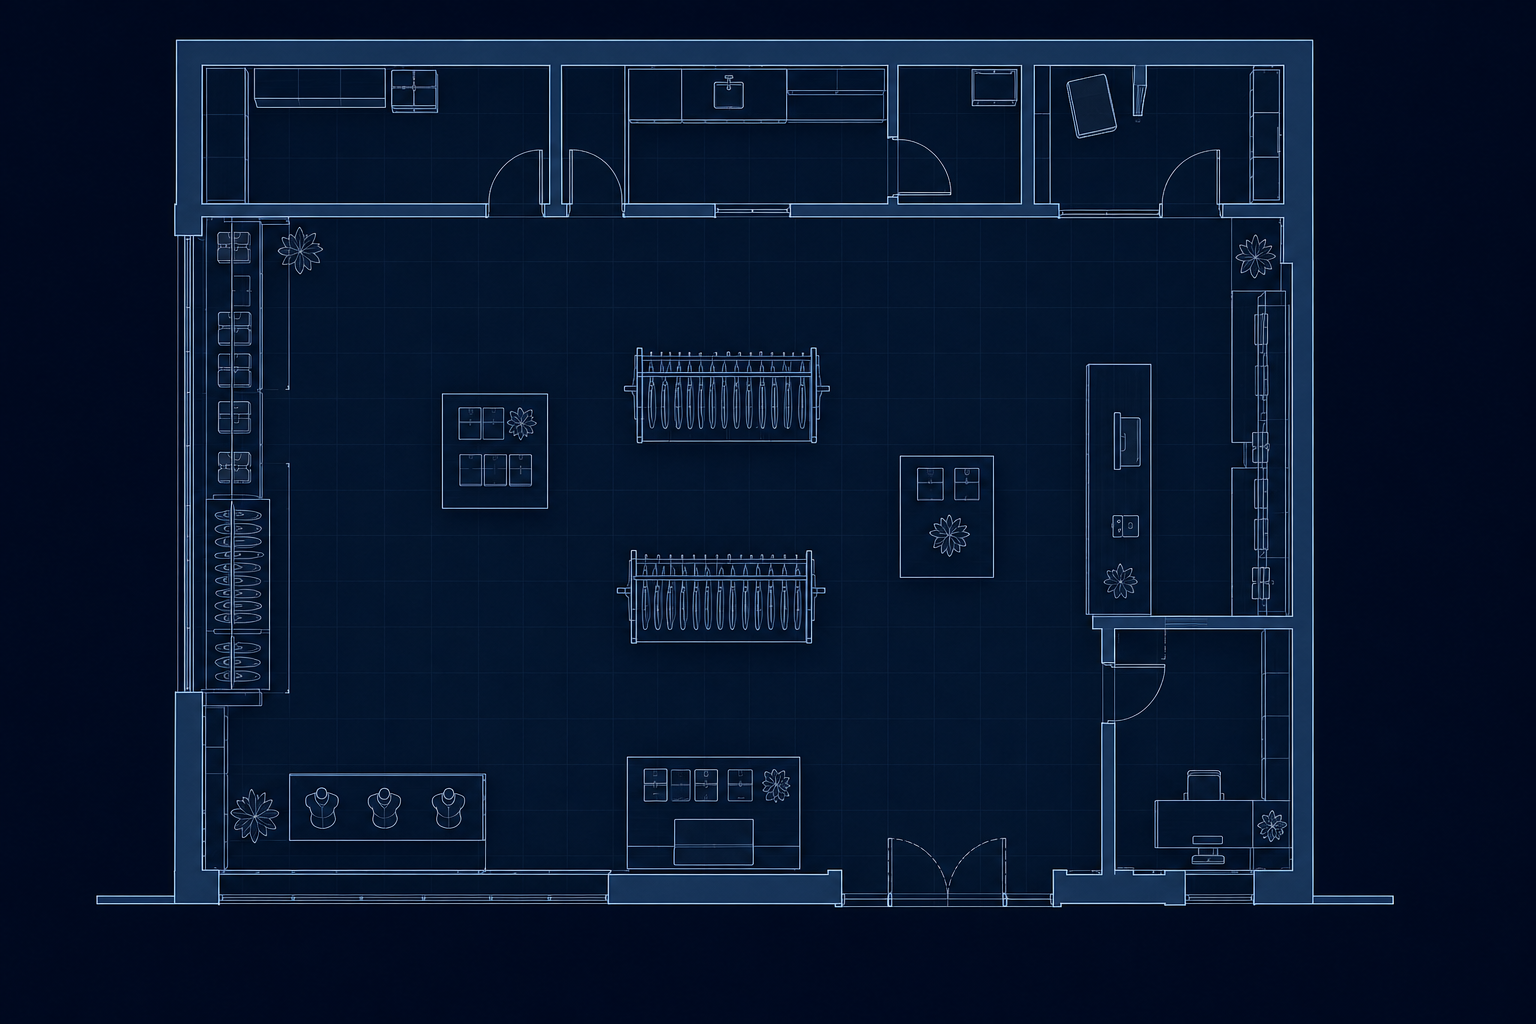
Illustrative occupancy map: Shoes accounts for 22% of time, Shirts 18%, and Trousers 15%.
Share of total occupancy time recorded across zones.
Distribution of completed visits.
Shoes accounts for 22% of occupancy time and gained +4 pp. The signal indicates greater attention; compare merchandising, availability, and service before attributing a cause.
Compare equivalent contexts
Confidence in every reading
Sentinela monitors your local cameras, processes data locally, and turns movement into clear information for your operation.
Data is processed locally in the store. During normal operation, analytics receives events instead of full videos.
Track the funnel, floor flow, zones, visit duration, and operational health in one management view.
No. It is an experimental journey inference after a checkout-qualified visit. It does not confirm a transaction, revenue, or POS data.
Not always. A qualified technician assesses compatibility, installs, certifies, and calibrates the system. The store team receives the solution ready to monitor.
It does not create cross-day profiles. Cross-camera continuity is limited to the active visit, with bounded crops and expiring embeddings.
Yes. Each store keeps its own configuration and can be compared using rates, equivalent periods, and comparable contexts.
Estimated purchase is an experimental journey inference and does not confirm a sale, revenue, or financial transaction.
Turn passers-by into an operational metric
See how Sentinela can measure your operation's physical funnel in a demo tailored to your scenario.